What does a speech waveform show?
A speech waveform is a visual display of speech over time. It shows changes in amplitude, which are related to loudness, and helps you see timing, pauses and speech rate. Used alongside a pitch trace, it can also show how the voice rises and falls in frequency. Waveforms can help illustrate the difference between voiced sounds, made with the vocal folds vibrating, and voiceless sounds, made without vibration.
Speech intensity and loudness
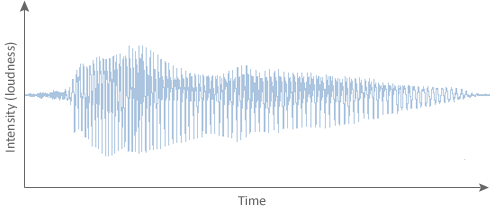
Speech intensity refers to the strength of the speech signal and is closely related to how loud the voice sounds. It is controlled mainly by the force of the air passing from the lungs through the voice box, or larynx. Increasing this airflow can make the voice louder, even if the pitch stays the same. On a speech waveform, intensity is shown by the height of the waveform, known as its amplitude. Larger movements usually indicate louder speech, while smaller movements indicate quieter speech or silence.
Loudness is commonly measured in decibels (dB). A whispered voice is often around 30 dB, while shouting may reach around 80–90 dB.
Pitch and frequency
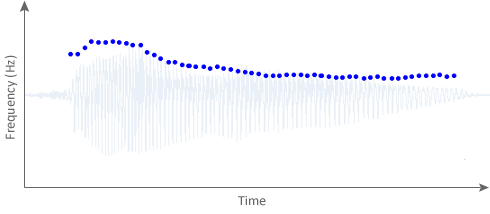
Unlike loudness, pitch is not shown directly by the height of the waveform. It is usually displayed as a separate pitch trace alongside the waveform. Pitch refers to how high or low the voice sounds and is determined by how quickly the vocal folds vibrate. Faster vibration produces a higher pitch; slower vibration produces a lower pitch.
Pitch is measured as frequency in Hertz (Hz), which means the number of vibrations per second. Average speaking pitch varies from person to person. A child's speech is often around 250–400 Hz, while adult female voices average around 200 Hz and adult male voices around 125 Hz. On the pitch display, frequency is plotted vertically, with time plotted horizontally.
Go beyond these waveforms
This page shows example waveforms, pitch traces and loudness displays, but the most useful comparison is with your own speech. Pronunciation Coach 3D records your voice and displays the recording as a waveform, with a pitch trace alongside a 3D pronunciation model, so you can compare what you said with how the sounds are produced and get an instant intelligibility score.
See how Pronunciation Coach 3D works →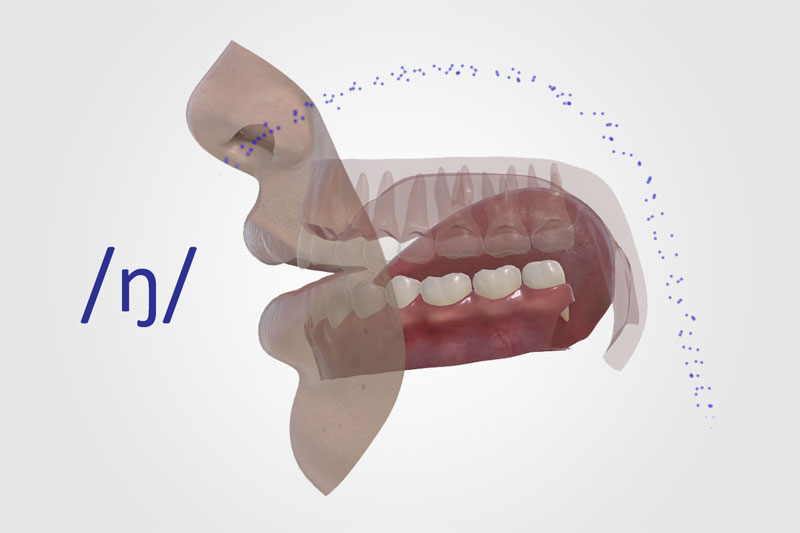
Frequently asked questions
A speech waveform is a visual representation of speech over time, showing how the amplitude of the sound changes moment to moment. Amplitude is related to loudness, so larger movements in the waveform usually indicate louder speech. Speech waveforms are often shown alongside a separate pitch trace, which plots the frequency of the voice.
A speech waveform is read like a graph: time runs along the horizontal axis, and amplitude is plotted on the vertical axis. Amplitude is related to loudness, so taller peaks usually mean louder sounds, while flatter sections usually indicate quieter speech, silence or a pause. Frequency, or pitch, is usually shown as a separate trace rather than in the waveform itself.
Pitch is how high or low a voice sounds. It depends on how fast the vocal folds vibrate and is measured in Hertz (Hz). Loudness is how loud or quiet a voice sounds. It is related to the strength of the speech signal and is commonly measured in decibels (dB). The two are independent: a speaker can keep the same pitch while getting louder or quieter.
Average speaking pitch varies by age, sex and individual voice. A child's voice is often around 250–400 Hz, while adult female voices average around 200 Hz and adult male voices around 125 Hz. These are broad averages rather than fixed limits.
A whispered voice is often around 30 dB, normal conversation is usually around 60 dB, and shouting can reach around 80–90 dB. These values are approximate because loudness depends on the speaker, distance from the microphone and recording conditions.
Voiced sounds, such as /b/, /d/ and vowels, are produced with the vocal folds vibrating. Voiceless sounds, such as /p/ and /t/, are produced without vocal fold vibration. In a waveform display, voiced sounds usually have a more regular repeating pattern, while voiceless sounds often appear more irregular or quieter.
Yes. Pronunciation Coach 3D records your speech and displays the recording as a speech waveform, with a pitch trace shown alongside it. It also shows a 3D pronunciation model, so you can compare your own speech with how the sounds are produced and get an instant intelligibility score.